

After some time, features and the database grow, machine load increases, and updates become more frequent. In all the hustle and bustle of everyday life, you’ve surely come across a dialogue similar to this one.
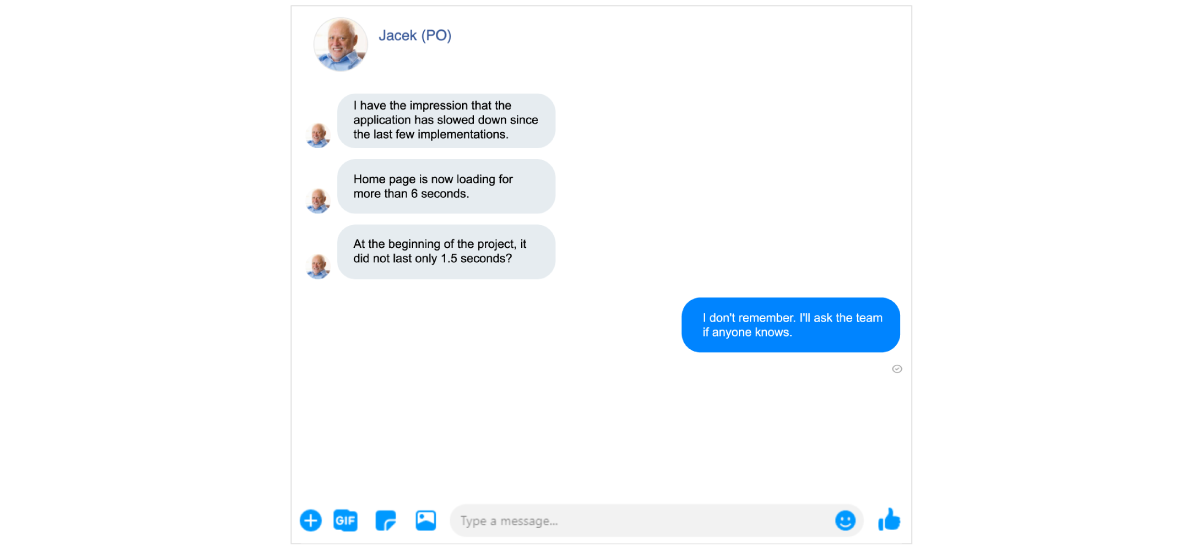
Project teams are often asked this. Sometimes the answer given is not correct because queries are not always monitored right. When trying to find the answer, you often have to search your memories from five weeks, five months, or five years back or consult outdated technical documentation.
How can we deal with this problem quickly and effectively? (There are many answers to this, but today’s will be of the simpler sort.)
We will use Postman to help us with performance monitoring (you’ll find an example and features of the monitoring below. If you already like the solution, setup instructions are further down). You can also read the article API testing – Postman for beginners.
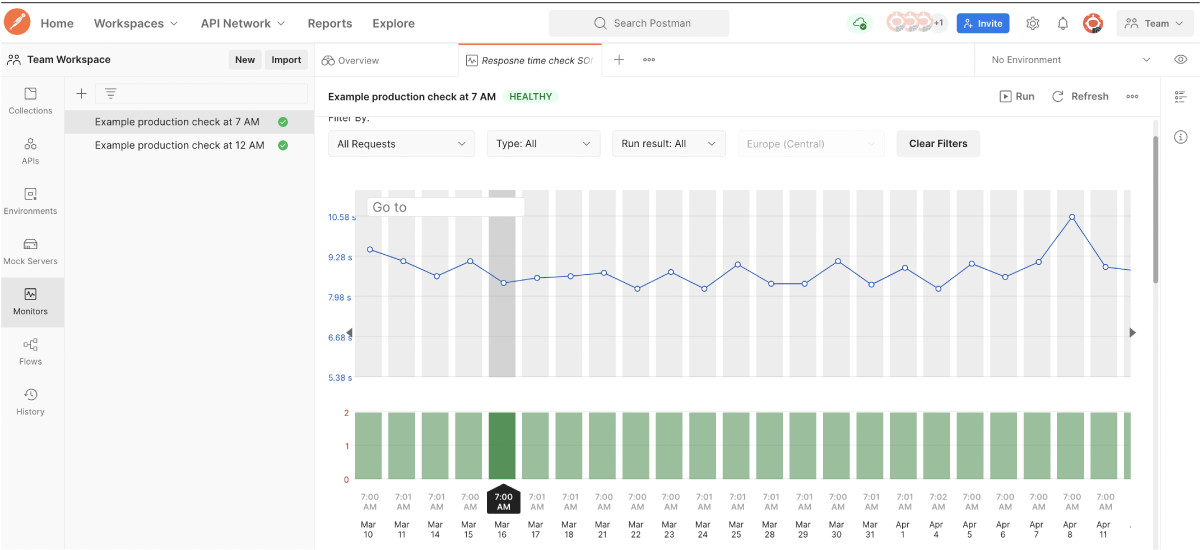
The Postman monitoring report can be viewed as a summary or by request. By selecting a specific bar representing a day, you’ll find a summary with details for each request.

The key feature of Postman monitoring is that every request can contain any assertion. In this case, we are interested in an assertion to verify the time from a query to the response. We can additionally verify the response code or content.
If the assertion is negative, you’ll be notified by e-mail.
The ease of performance monitoring setup is a great asset. The report covers history, a timeline, response times, and query metric on any environment with the assertions verified with the request.
The benefits of monitoring are undeniable. You detect delays in API responses early, so you can figure out whether it’s because of the latest release, overload, or maybe other factors. You have time to take action before a disaster happens.
(The Postman free plan offers 1000 API monitoring calls a month)
How to setup monitoring:
If you don’t have a collection, you need to create it (detailed instructions in the Postman tutorial).
In this example, we’ll use a more advanced API query, which is secured with an access authorisation token (in the Tests tab, I fetch an authorisation token for the variable).

if (responseCode.code === 200){
try{
var tokenData = JSON.parse(responseBody),
token = tokenData.access_token;
}
catch(e){
console.log(e);
}
postman.setGlobalVariable("myToken",`Bearer ${token}`)
}
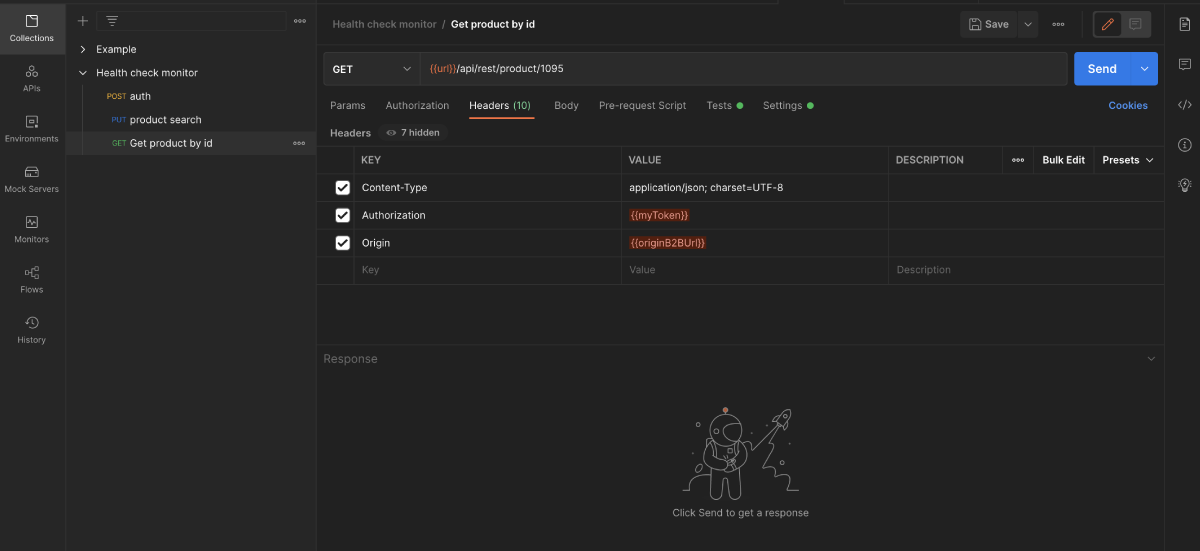
Then, I pass the token in the Headers section in the target query as shown below.
Time for the magic. I enter any assertion in the Tests tab, for example, about the response time and response code (remember that you can expand the verification with any assertion, for example, to verify response content).

pm.test("Status code is 200", function () {
pm.response.to.have.status(200);
});
pm.test("Response time is less than 2000ms", function () {
pm.expect(pm.response.responseTime).to.be.below(2000);
});
Here, we verify whether the status is 200 and the response time is shorter than 2 seconds.
Time to set up the monitor.
Select the Monitors tab, then Create a monitor and fill in the fields as needed according to the video.
Enter the monitor name, select the collection, the environment (if you use variables), frequency of calls, and who to notify about fails.
That’s it. The monitor is ready to notify us about any problems (hope none will come up). After some time, features and the database grow, machine load increases, and updates become more frequent. In all the hustle and bustle of everyday life, you’ve surely come across a dialogue similar to this one.


